The only network-based, visual intelligence software solution for mission-critical operations
vis/ability Software
Learn More
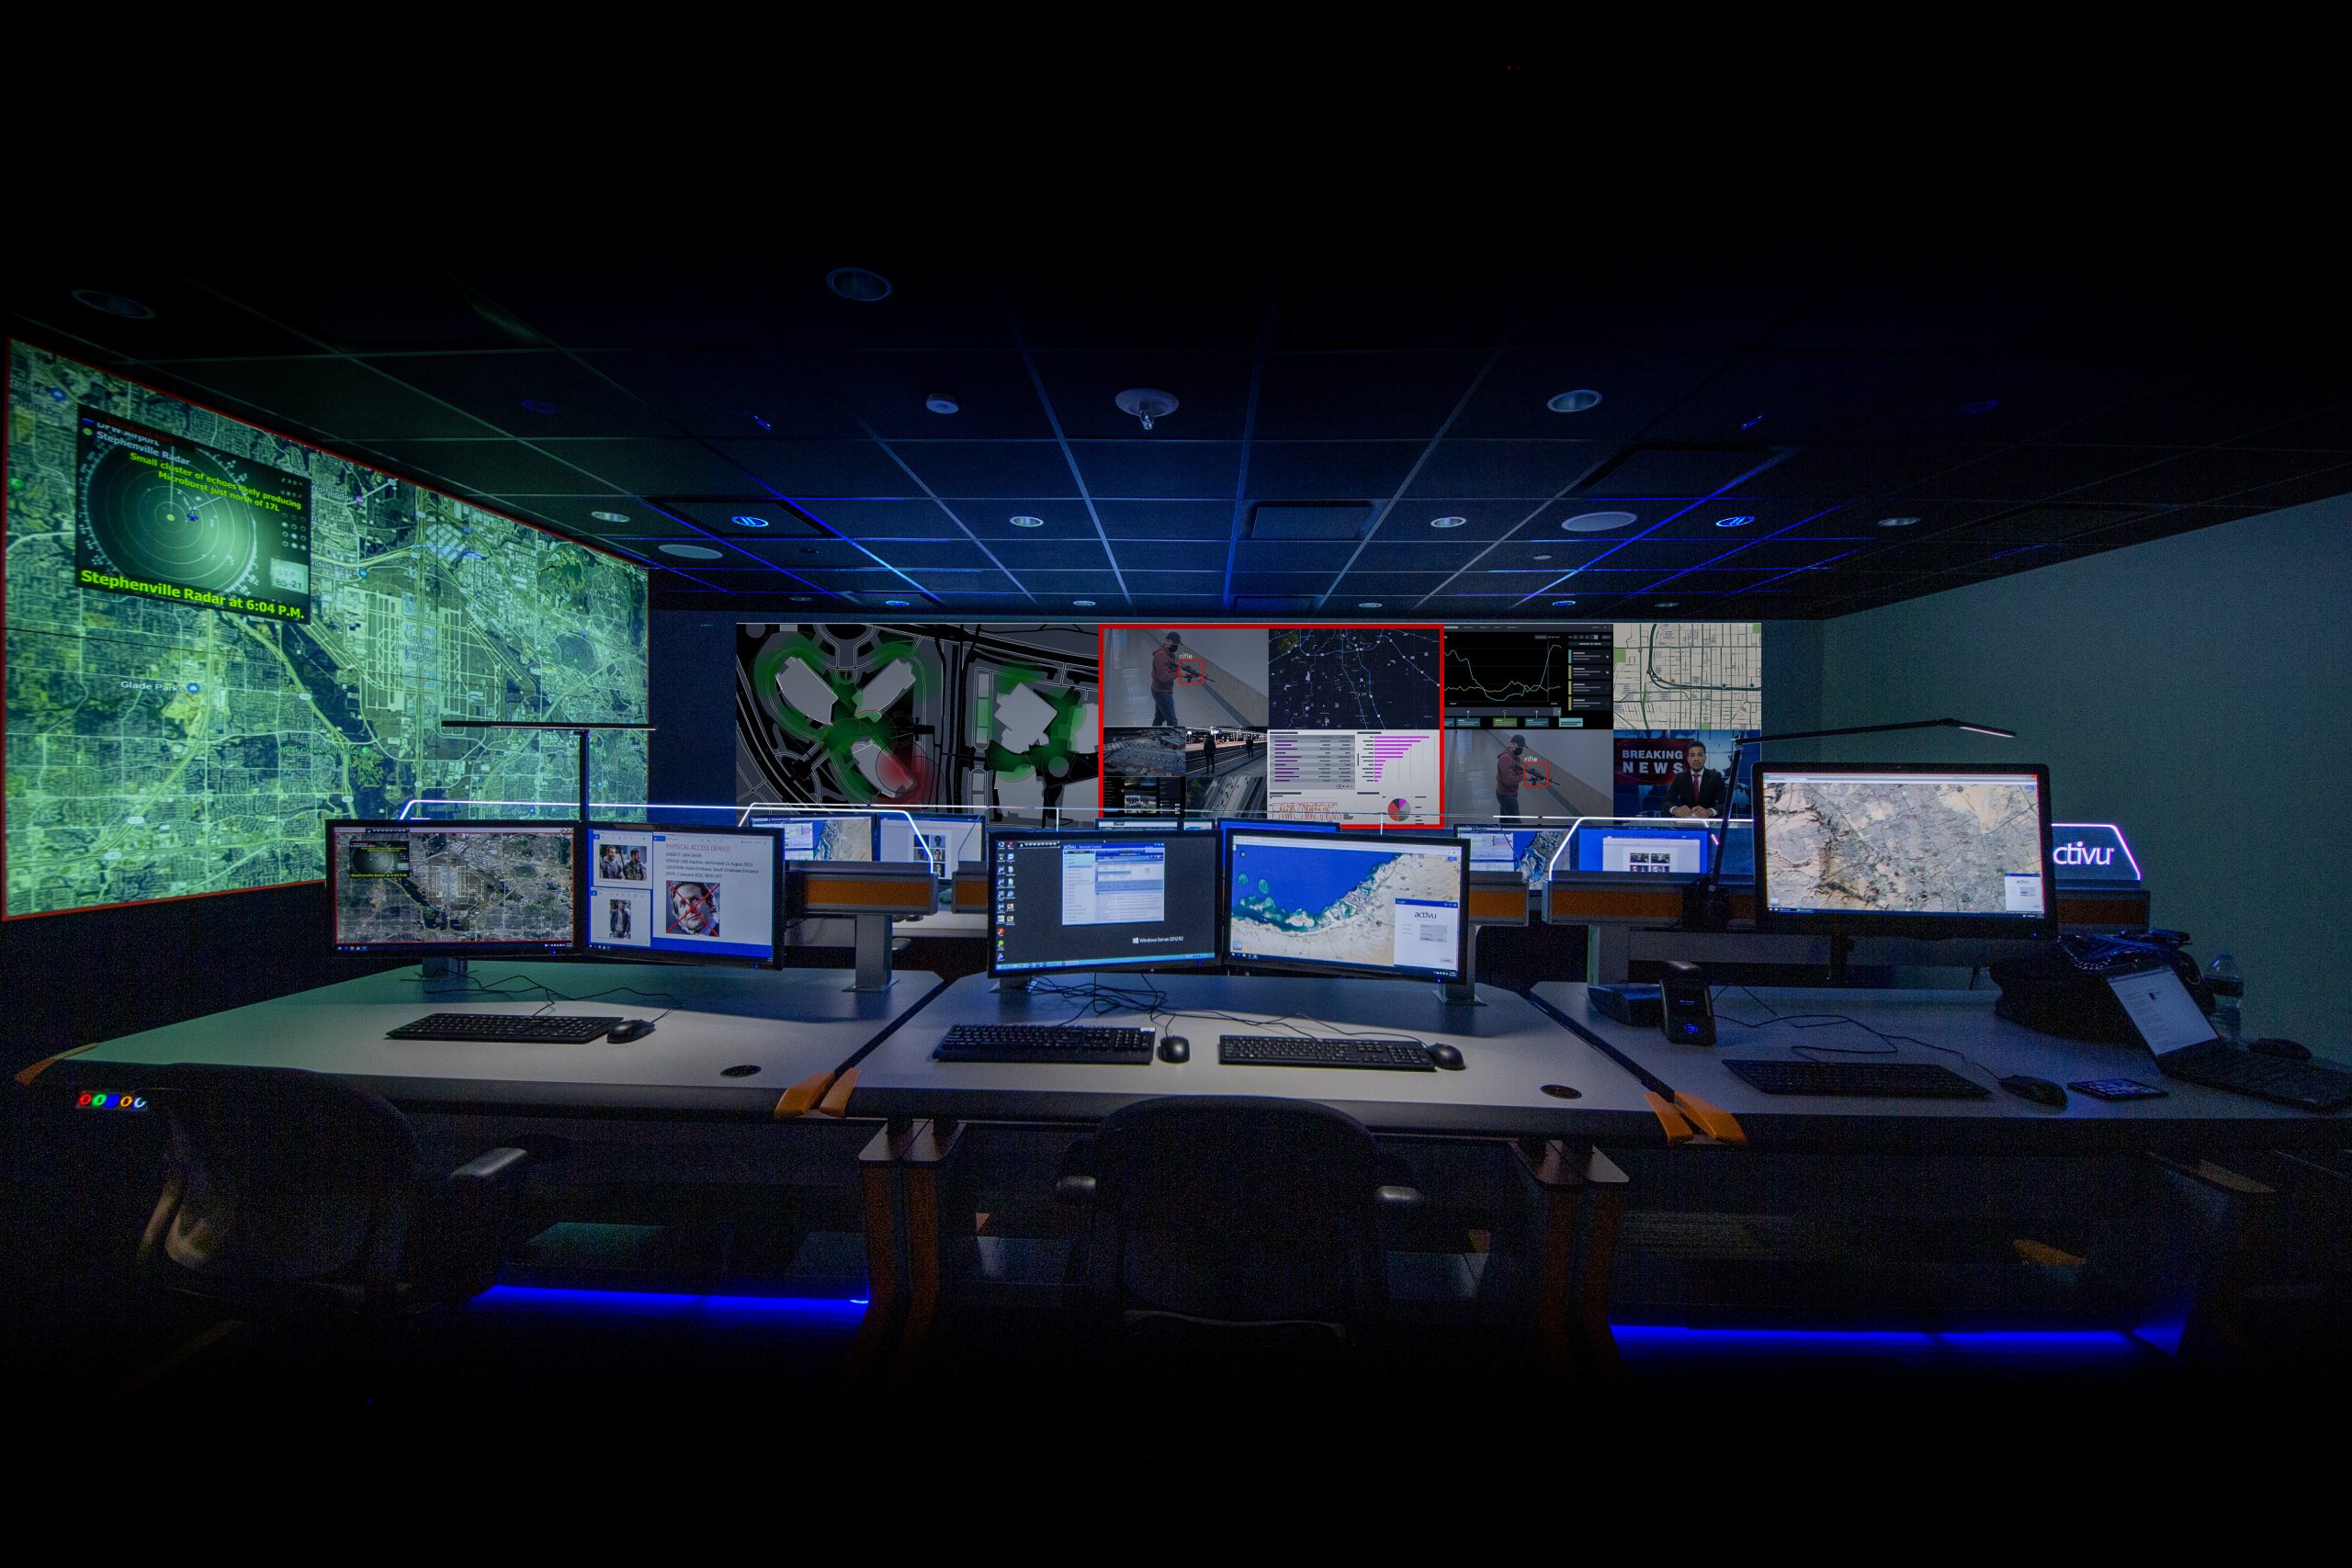
Control Room & Video Wall Solutions
The only network-based, visual intelligence software solution for mission-critical operations
Incident monitoring for NOCs, SOCs, Fusion Centers, IT, & Cyber
Activu designs, builds, and supports Control Rooms & Command Centers, SOCs, GSOCs, Fusion Centers, and SCIFs with Video Walls and…

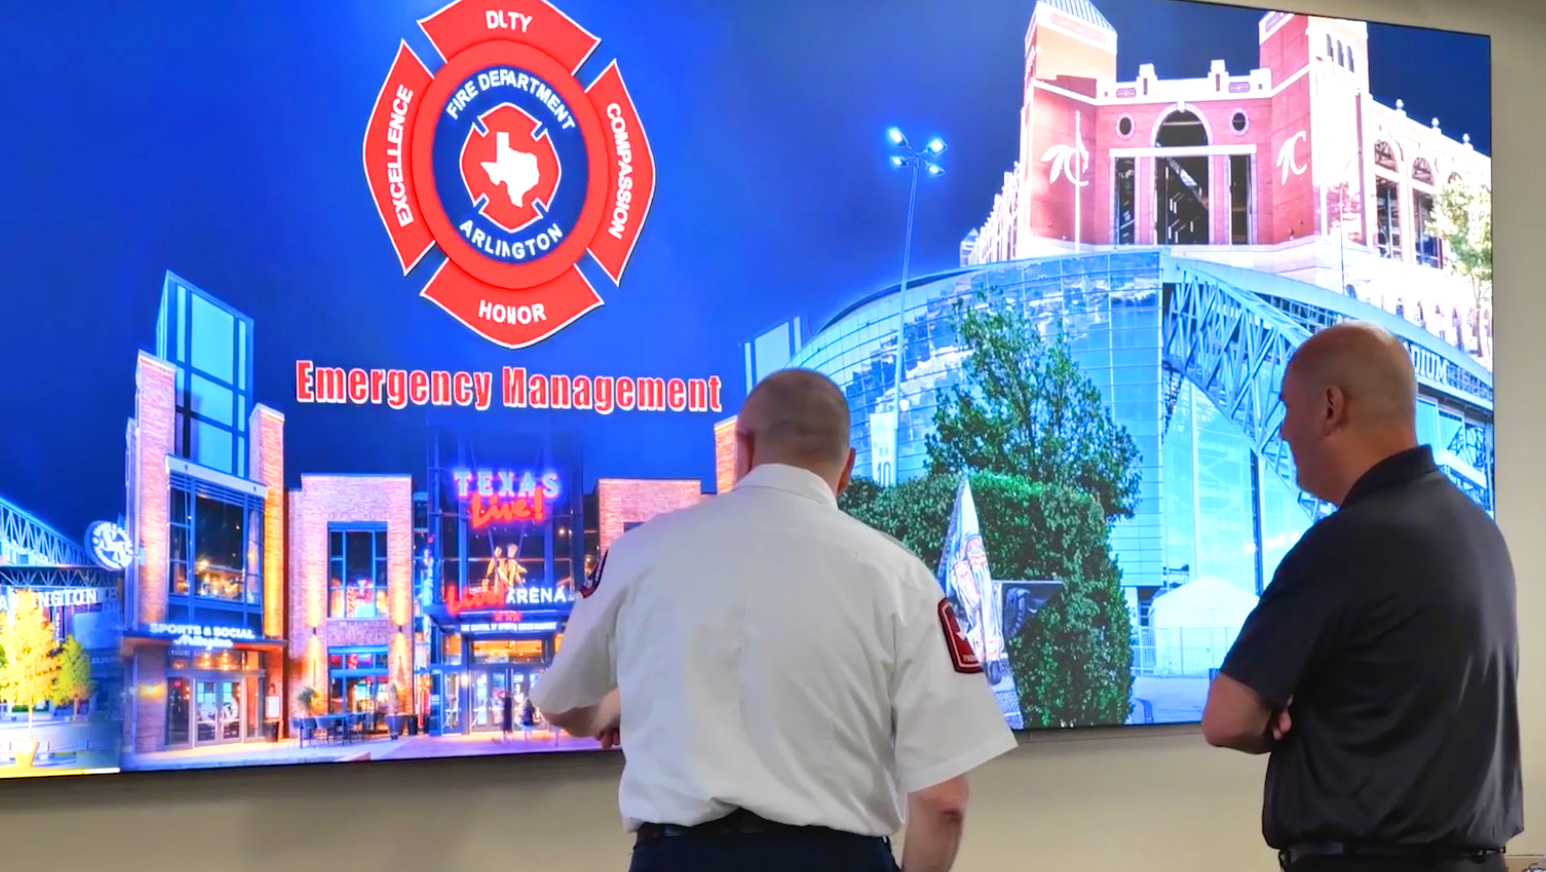
Case Study – Arlington EOC
Managing the Unexpected in the Entertainment Capital of Texas

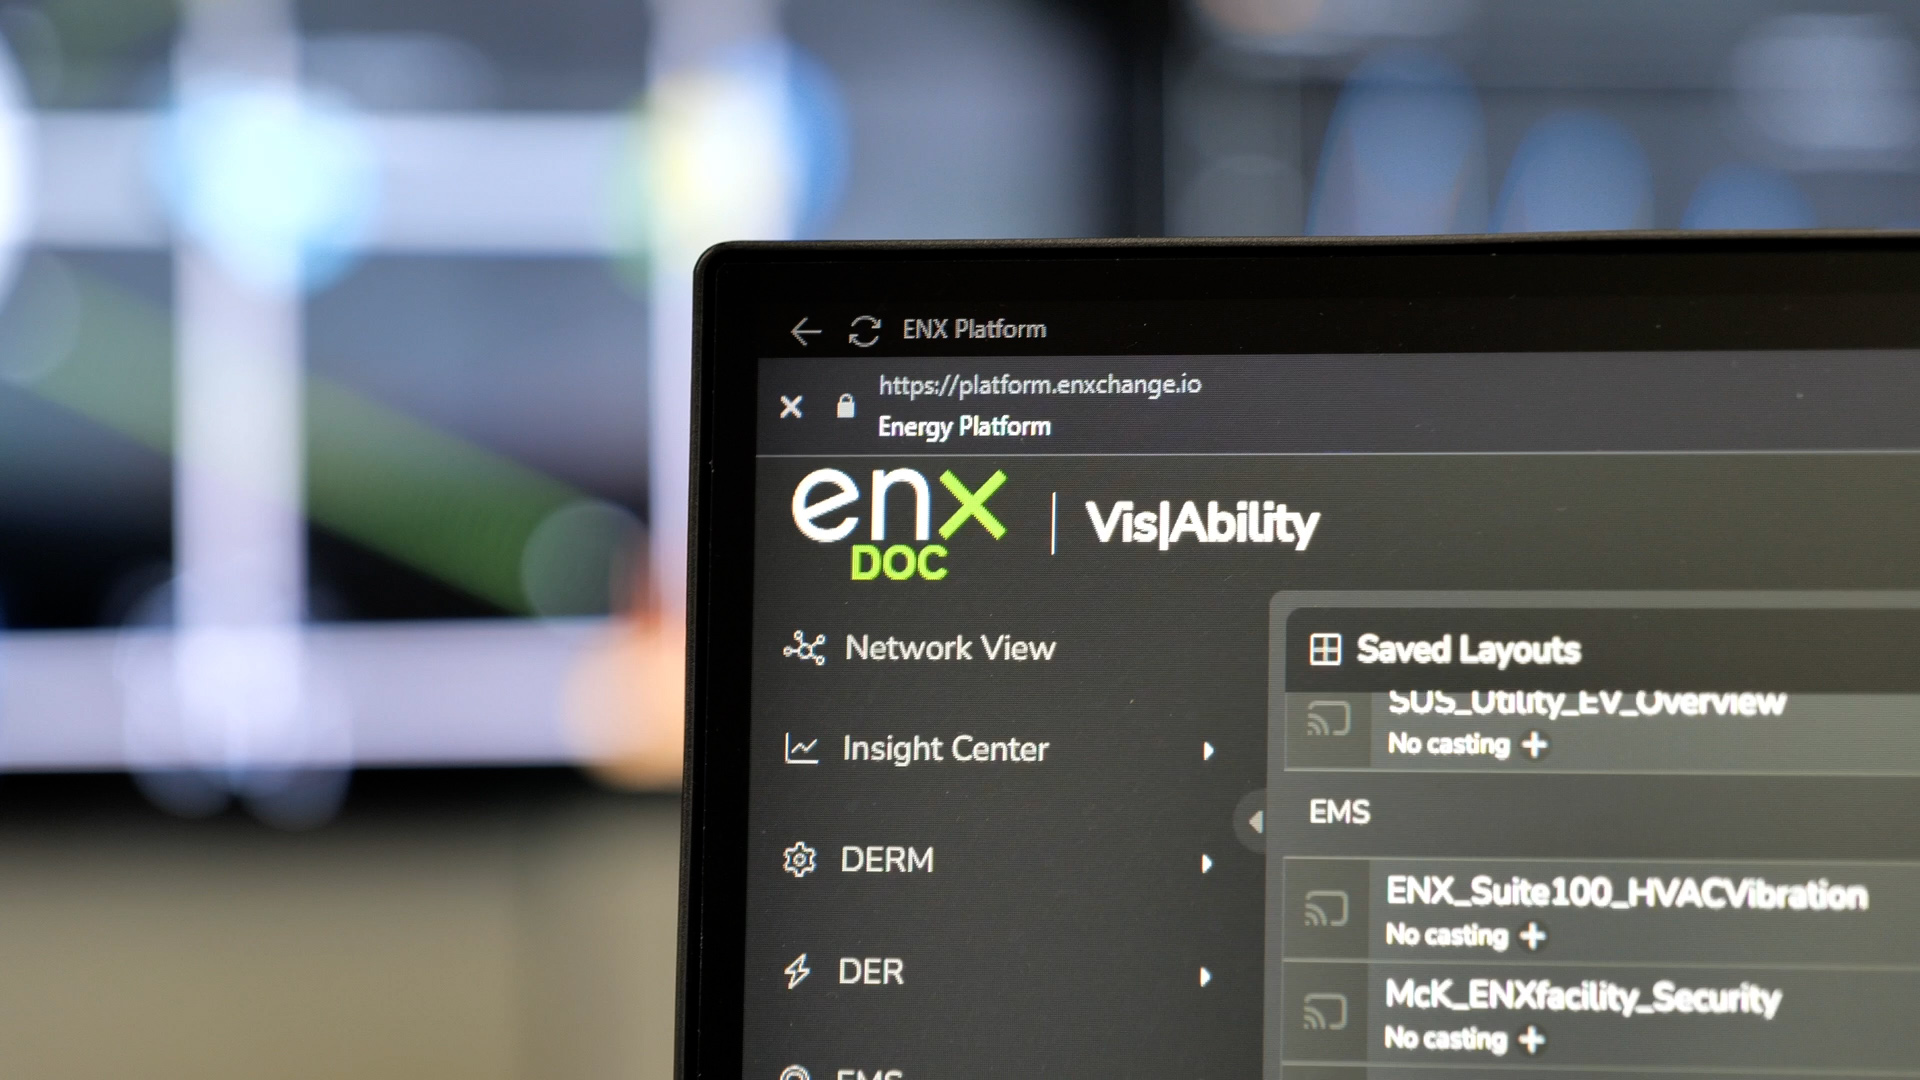
Case Study – enx vis/ability
Virtual Power Plants, Digital Twins, and a More Connected World
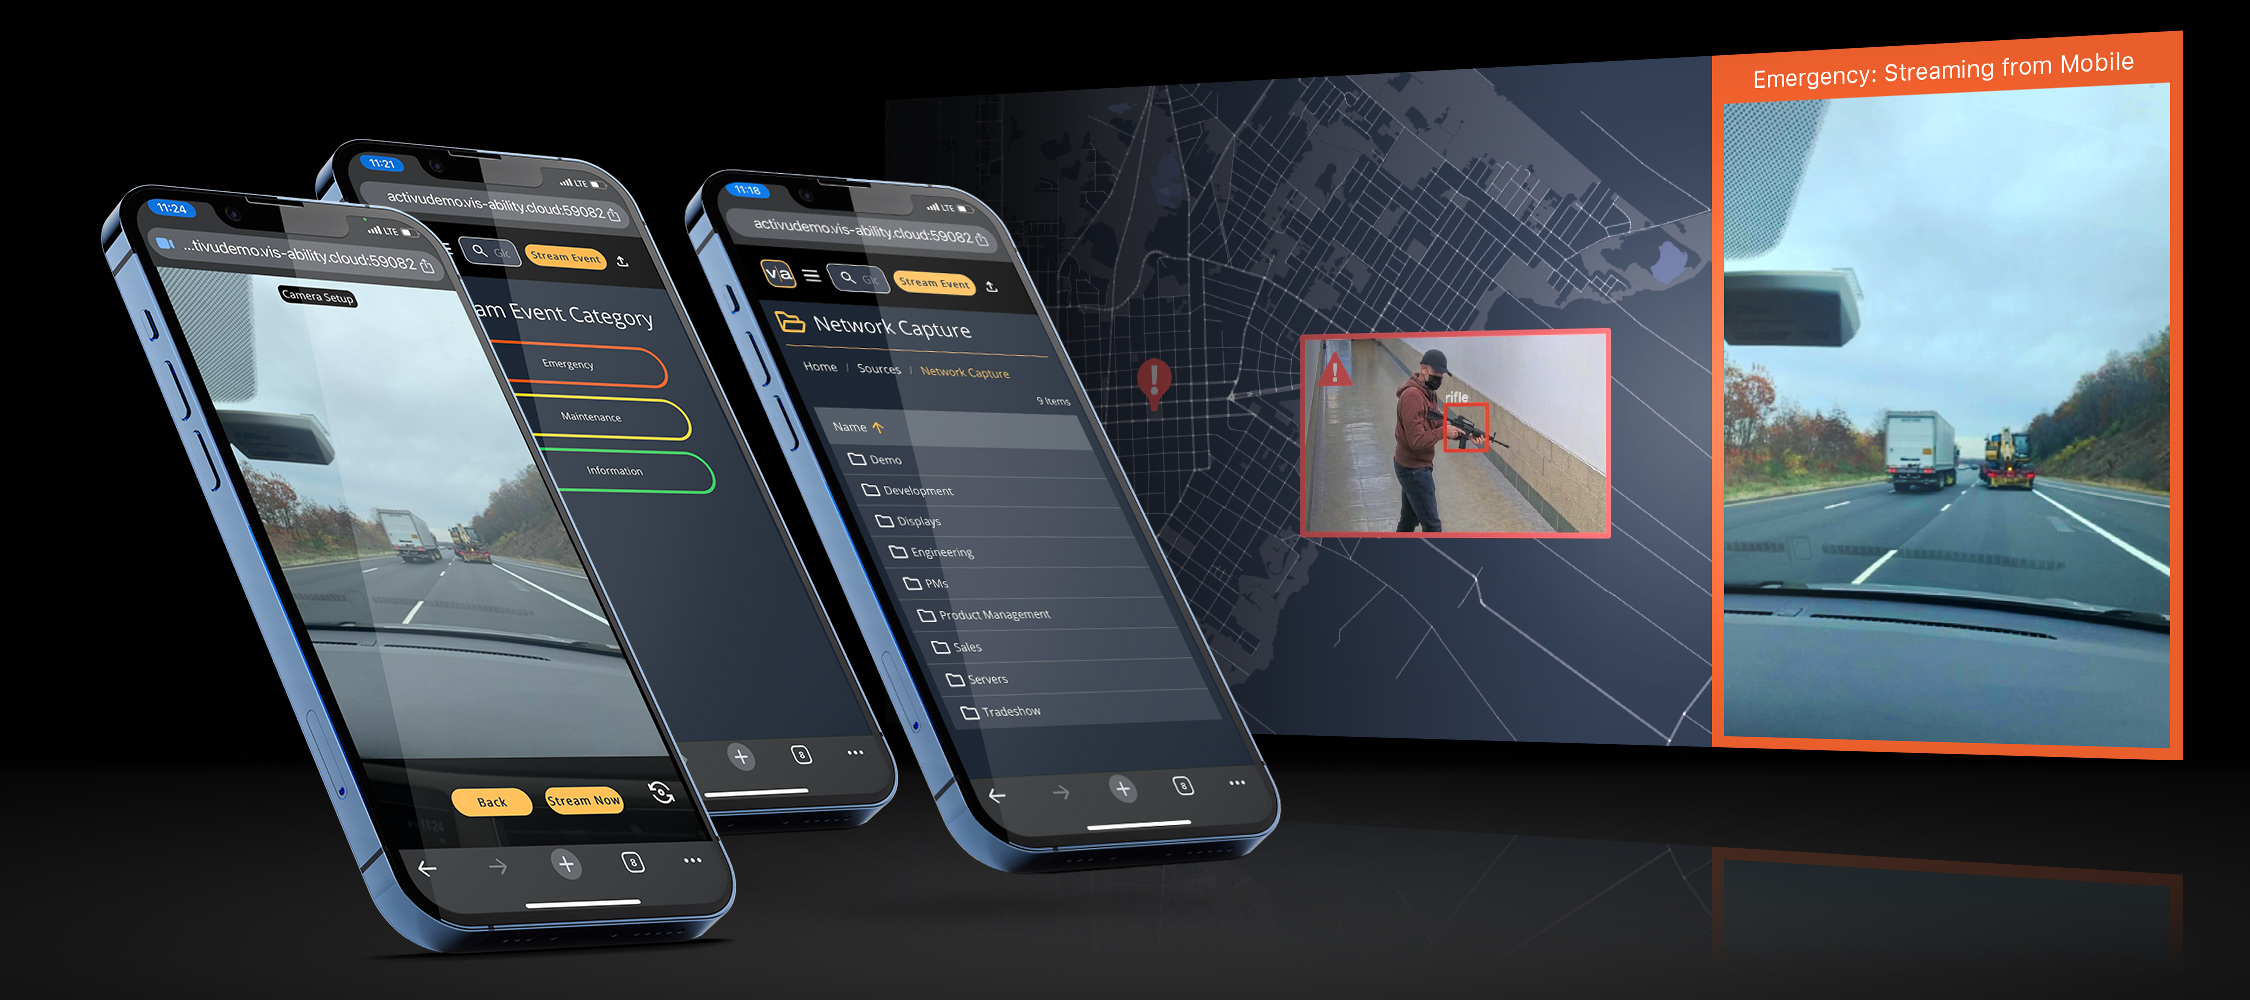
Press Release – vis/ability 6.6
Vis/ability 6.6 Enhances Incident Response & Communication for RTCCs, EOCs, & Other Security Operations

News Story – Activu GSOC
The NFL’s Activu GSOC takes center stage in getting players back on the field

Case Study – Global Sports League
An elegant control room solution for a high-profile, enterprise-security challenge
Insights – RTCC Technology
3 Forward-Looking Trends in RTCCs

Case Study – Adecco Group
Staying on course in the throes of a global pandemic

Press Release – vis/ability
Activu vis/ability Now Certified in the ServiceNow Store

Case Study – A Fortune 500 Bank
Modernizing the digital business

Case Study – A Fortune 500 Global Logistics Company
Improving Global Maritime Situational Awareness, Digitally

Visability makes any information visible, collaborative, and proactive for people tasked with monitoring critical operations. Users of the platform see, share, and respond to events in real time, with context, to improve incident response, decision-making, and management.
Activu software, systems, and services benefit the daily lives of billions of people around the world. Founded in 1983, Activu was the first US-based company to develop control room visualization technology. More than 1,300 control rooms, monitoring, security, & operations centers depend on Activu.
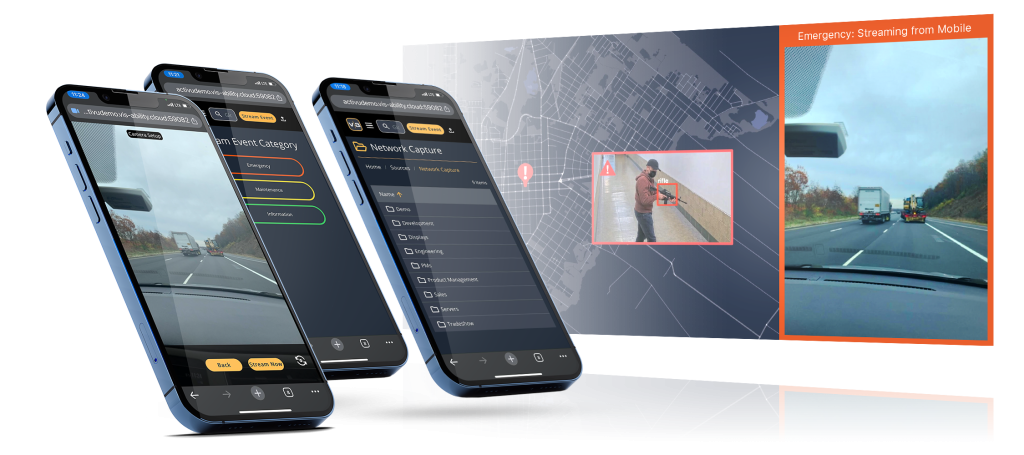
Visability 6.6 Enhances Incident Response & Communication, with New Event Management, Mobile Video Streaming, Zoom Meetings, and Active Shooter Recognition, via Omnilert Integration.
RTCCs, EOCs, and other Security Operations Centers benefit from more safety automations and critical, on-the-go collaboration features in visability.


Future Source Reports