By Paul Noble
Part 1: Visual Space
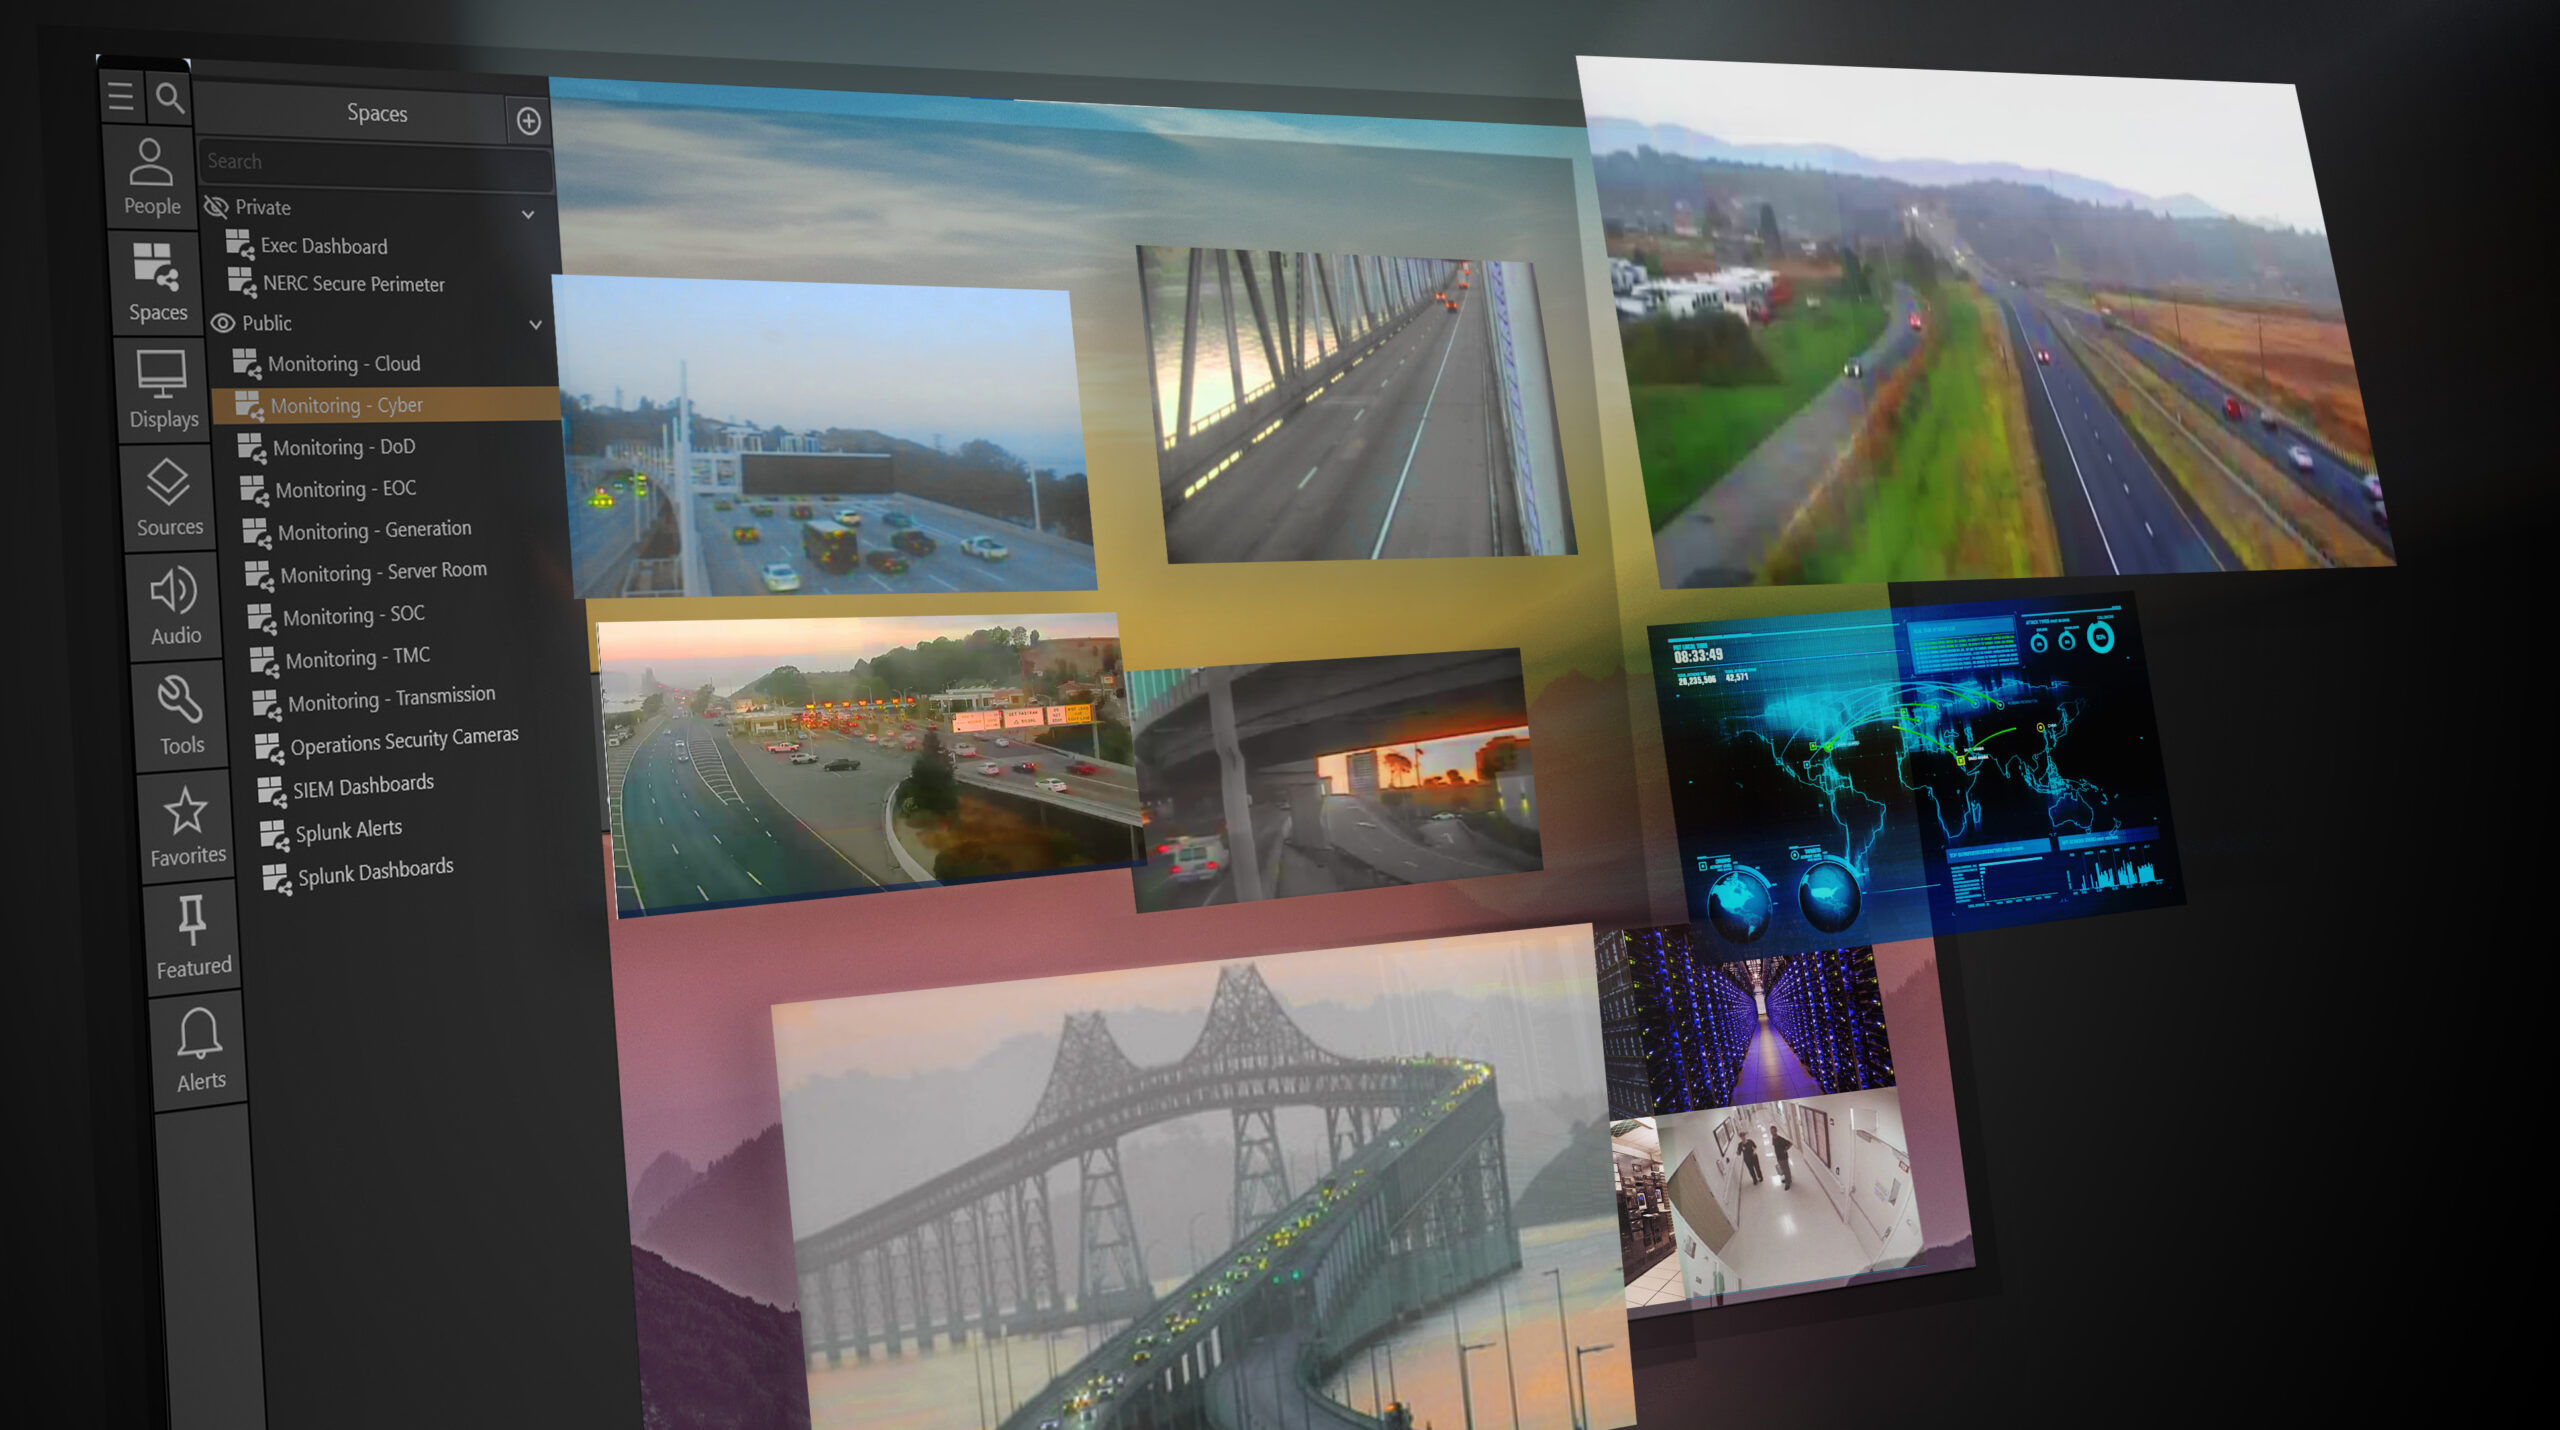
The goal of visualization in a control room or command center should be to optimally fill each occupant’s visual space with actionable information: between their personal console mounted displays and typically today a video wall that shows a common operating picture: shared information important to all.
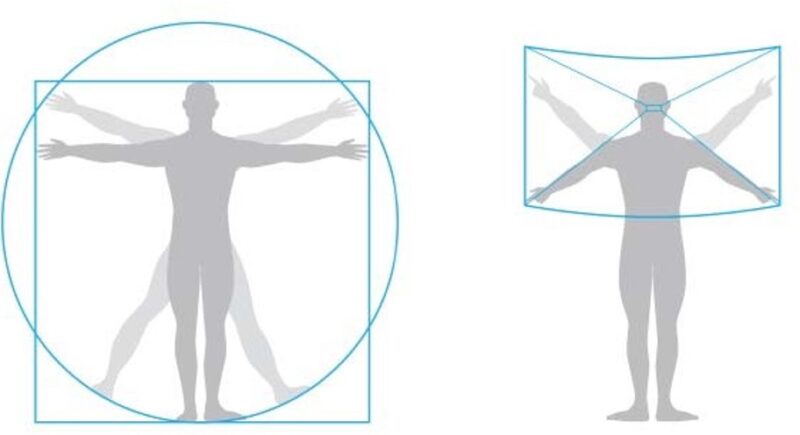
Just as with human physical space, it’s easy to measure our visual space. Just extend your arms and map out the area that you can comfortably see without twisting your neck: typically, around 90 degrees horizontally and 60 degrees vertically.
The other component to consider is information density: just how much information can effectively fit into this visual space?
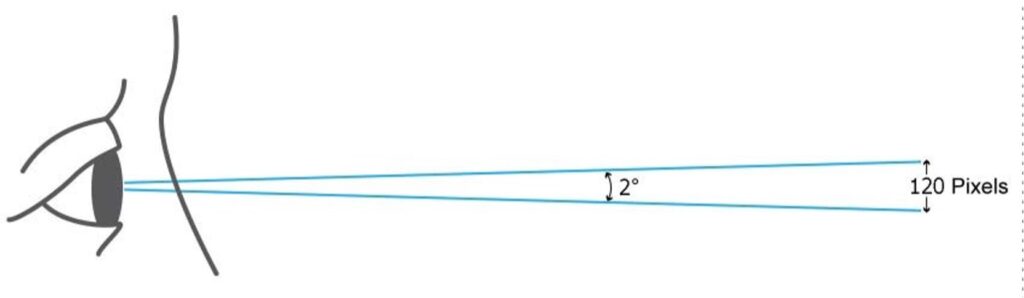
The human eye (with 20/20 vision) has an angular resolution, at its very center only, of approximately 60 pixels per degree. (For the technically curious I have provided a detailed discussion of visual acuity in an addendum to this white paper.)
We “read” information by constantly scanning our eyes since only approximately two degrees of human vision within the very center of the eye, the Fovea, is optimally sharp: in both visual and mental focus. Our peripheral vision is much more sensitive to movement than detail and quite subconscious.
With arms extended, hold your two thumbs together. Focus on one thumb and the other thumb is slightly out of focus. Your two thumbs only represent around three degrees of your visual arc.
An evolutionary explanation: our early ancestors above all needed a good sense of movement in their peripheral vision to avoid getting eaten by predators. Those who didn’t were! This natural selection is why today we can drive down the highway looking at our car’s infotainment screen without causing an accident!
We can easily calculate the human visual space in pixels: 90 degrees x 60 pixels = 5,400 horizontal pixels and 60 degrees x 60 pixel = 3,600 vertical pixels. 5,400 x 3,600 = around 20 million pixels, total. That’s it.
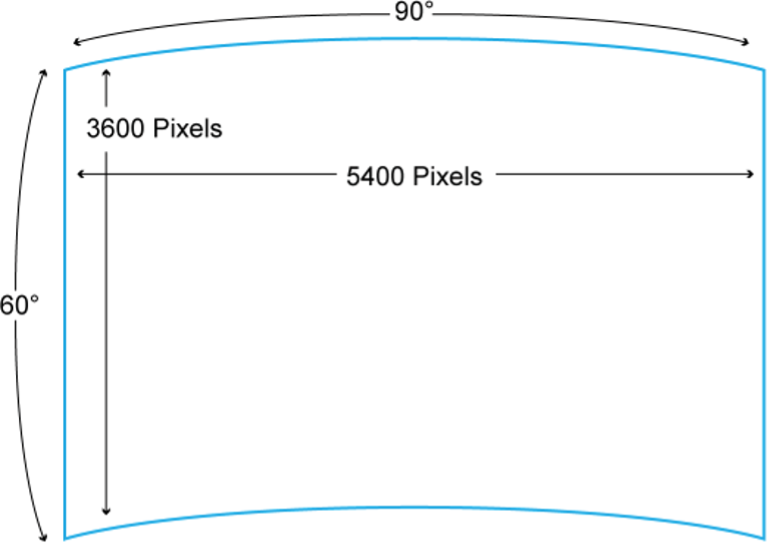
Those pixels can be on console-mounted displays, on wall displays, on the console desk surface itself, or in the form of printed material, but without turning one’s head at any one time, one can comfortably only see or read around 20 million pixels worth of information in all.
So, the goal is to match the display pixel density to the viewing distance such that the individual is viewing the maximum information density that he/she can comfortably see. The other factor in data display is font size, which should be large enough for the furthest viewer to read. But fonts can be adjusted in software and are only hardware dependent insomuch as the display pixel density needs to match or exceed the visual acuity of the viewer to avoid pixelation or blurring of the display content which will degrade readability.
Note: depending on the articulation of the operators’ console seating, a comfortable amount of swiveling side to side and rocking back could effectively expand their visual space to around 120 degrees horizontally x 90 degrees vertically for a total pixel count of around 7,200 x 5,400 – a doubling of their visual to close to 40 million pixels.
Part 2: Display Technology – Going Retinal
Desktop Displays
Apple popularized the concept of ‘Retina’ displays, and this is the very same concept: delivering the maximum pixel density that the user can comfortably resolve at the normal viewing distance for each device type and (screen) size.
A display that had significantly greater pixel density than the viewer’s eye could resolve would be as unnecessary as a sound system that reproduced sound well beyond the range of human hearing.
A decade ago, desktop displays had a pixel density significantly lower than the eye’s resolution. Even a full HD (1920 x 1080) resolution 24” desktop display viewed at 24” had a pixel density closer to half that of the eye’s resolving power. So, desktop displays were suboptimal, less than retina resolution: not as sharp as the eye.
This changed with the introduction of a new generation of low-cost desktop computer displays with a resolution of 3,840 x 2,160. These ultra-high-resolution screens conform to a new format, UHD, which is four times the resolution of full HD (1920 x 1080), 8.3MP (million pixels) per display. Today 27” UHD thin-mullioned screens cost around $250 and two such screens and an auxiliary graphics card, if required, can be purchased for under $600. Substituting 32” displays cost barely more.
Desktop displays are marketed as ‘UHD’, but TVs as ‘4K’, though they have an identical resolution (3840 x 2160) and aspect ratio (16:9). 4K is actually a digital video production standard with a slightly wider aspect ratio (17:9) and a resolution of 4096 x 2160. Calling TVs ‘4K’ was a marketing decision that capitalized on consumer associations with the professional cinema standard.
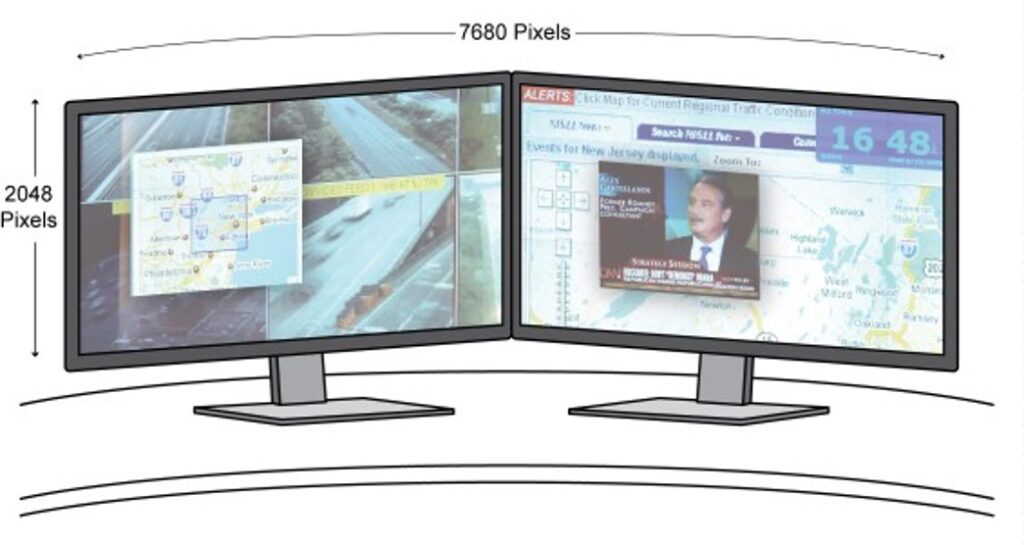
These monitors are at the limit of human visual acuity at a viewing distance of around 21”, making them ideal for control room console use. Two such side-by-side monitors slightly angled would cover all the operators’ horizontal visual space at their optimal viewing distance and between 40% and 60% of their vertical visual space: around 40% if they can comfortably pivot back in their chairs, around 60% if their chairs don’t articulate. Where there is no common wall display, a 2×2 (32MP) or even a 2×3 (48MP) matrix of these monitors can effectively fill the operators’ full visual space with information.
Dell, Samsung and others have more recently introduced single, curved 49” wide, 18” high 32:9 LCD displays initially targeting the gaming market, with a resolution of 5120 x 1440 (7.4MP), for under $1,000 – that’s less resolution than a single 4K screen, but seamlessly filling the full physical desktop. In the future, paper-thin, flexible OLED or micro-LED based screens might enable a single super-wide, seamless, curved desktop display of virtually any size, shape and resolution, but thin mullioned 4k/UHD screens are already revolutionizing console display, and at a nominal cost.
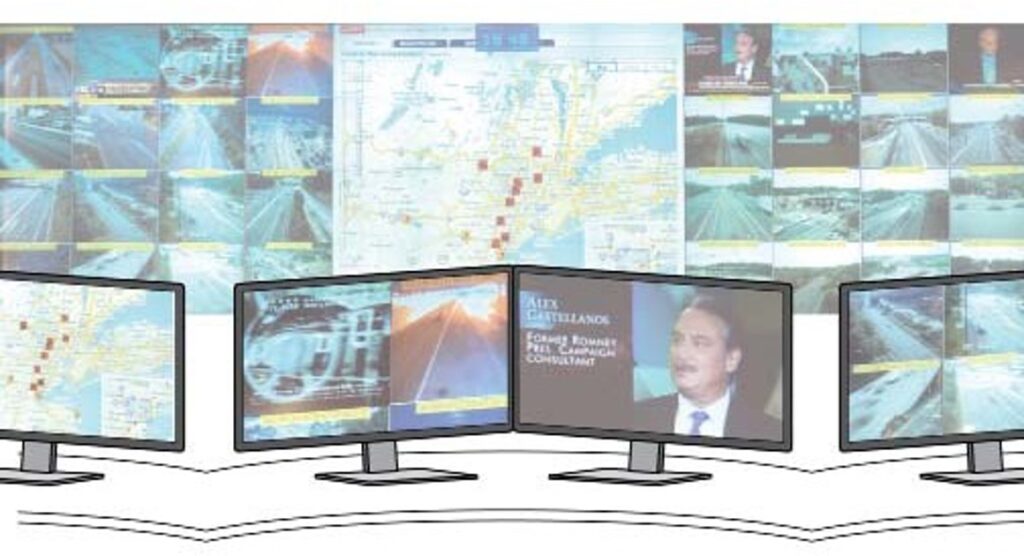
Video Wall Displays
So, what of the upper 40-60% of the operator’s visual space? Today’s video wall technology can and should match the operator’s visual acuity in the first row of consoles but with content ideally scaled to be readable by those further back.
There is a simple formula that can inform your selection of an appropriate video wall pixel pitch. The pixel pitch in millimeters x 111 gives you the approximate minimum recommended viewing distance in feet. Inversely the pixel pitch in millimeters divided by 111 gives you the recommended minimum viewing distance in feet. So, a 0.9mm LED display should ideally be viewed from at least 10ft, 1.2mm 13ft, 1.5mm, 16.5ft. For meters the factor is 3.51. (This formula is for control room display of both data and video. Video only display, e.g., some digital signage applications, requires less pixel density, for a given viewing distance.)
If you are using a standard 55” LCD matrix, the very fine pixel pitch (0.63mm) exceeds most any viewing distance requirement. But when selecting a seamless LED display, the new video wall display technology gold standard, choosing the correct pixel pitch is key, since the finer the pixel pitch the higher the cost. Select a higher pixel pitch than necessary and you will pay a lot more. Select a lower pixel pitch than required and your closest operators will have an uncomfortable, pixelated viewing experience!
Part 3: Information Everywhere
The Display Continuum
With the advent of IP based control room software platforms, content can easily move between screens within and beyond the control room, delivering information wherever it is needed: on video walls, desktop displays and mobile devices. It can be shared and collaborated on. It can be incident-triggered: automatically distributed to decision makers wherever they are, in the control room or in the field, on any network accessible display or device.
In this environment there is little practical delineation between the individual and group display space, including the further seamless flow of information into the truly personal visual space enabled by mobile displays: smartphones and tablets, and even VR headsets.
This enables a continuum of personal visual space delivering actionable information to an operator or decision maker wherever they are.
This technology shift should lead to a more dynamic environment of mission critical information gathering and display and information sharing and collaboration within and beyond the control room or command center, resulting in more informed and faster decision-making wherever the decision maker happens to be.
The only constants are the resolution of the eye, the human visual space, and the need to ensure that display resolution, size and location are a good match.
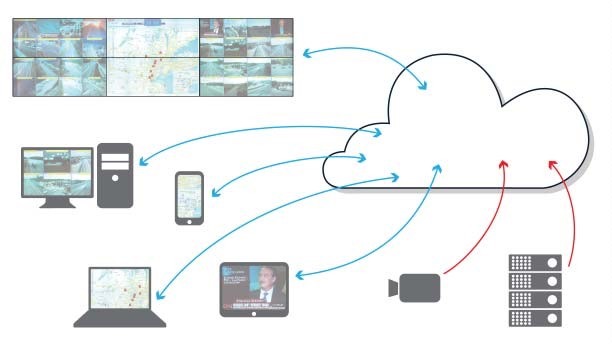
Note: in this new network connected world, display devices can also themselves be information sources: sending photos or streaming video back to the command center. Meanwhile, desktop computer application windows or full screens can be displayed on a video wall, and an application window or the full aggregated content of a video wall can be viewed on a desktop or mobile device or mirrored on a video wall at another location, e.g., a backup site. The only practical limits are typically those imposed by security and other operational considerations.
An Epitaph
The era of stove-piped, hardwired, circuit-switched, proprietary hardware driven display technology is dead. The future of visualization is a networked, packet-switched, software-based platform, running on standard IT hardware, on-prem or in the cloud, deeply integrated within an organization’s networked information technology ecosystem, delivering real-time, actionable information to decision makers wherever they are.
Part 4. The Future Is Now
The future of control room visualization is seamless visualization extending from the personal to the individual to the group and extending from the physical control room or command center into the field. Actionable information can seamlessly flow to wherever and whenever it is needed by decision makers, wherever they happen to be, so that they can make smarter, faster and more collaborative decisions.
And in an increasingly information rich environment, there is an increasing need for information flow to be automated, and event driven so that only relevant, actionable information is presented to decision makers, to avoid information overload.
Critical to achieving this vision is implementing a network software-based, visualization platform that integrates both with an expanding range of internal and external information sources and which also integrates with the monitoring, alerting and analytical software that filters the ever-increasing information flow for actionable intelligence, allowing incident- or event-driven visualization. AI will play an increasing role in automating this process.
This visualization platform must also integrate with and be capable of adapting to an expanding and evolving range of display options from advanced video walls to ultra-high resolution desktop displays to tablets, smartphones and in the future wearable personal display technology.
Your visualization infrastructure becomes a fully integrated component of your information ecosystem, evolving and adapting over time to new information sources and information display technologies.
Addendum:
Paul Noble is an entrepreneur with a blend of technical and business experience. He founded Activu Corporation (formerly Imtech) over forty years ago in New York, as the first company to design and manufacture video wall technology in the United States. Born in London, Paul attended the London Film School and had an early career in film and television before moving to the United States. He later went on to receive an MBA from Columbia Business School. He can be reached at Activu’s contact form here.
- The exact factor is 11.27 for feet, 3.44 for meters. ↩︎